NBA is almost statistically sadistic
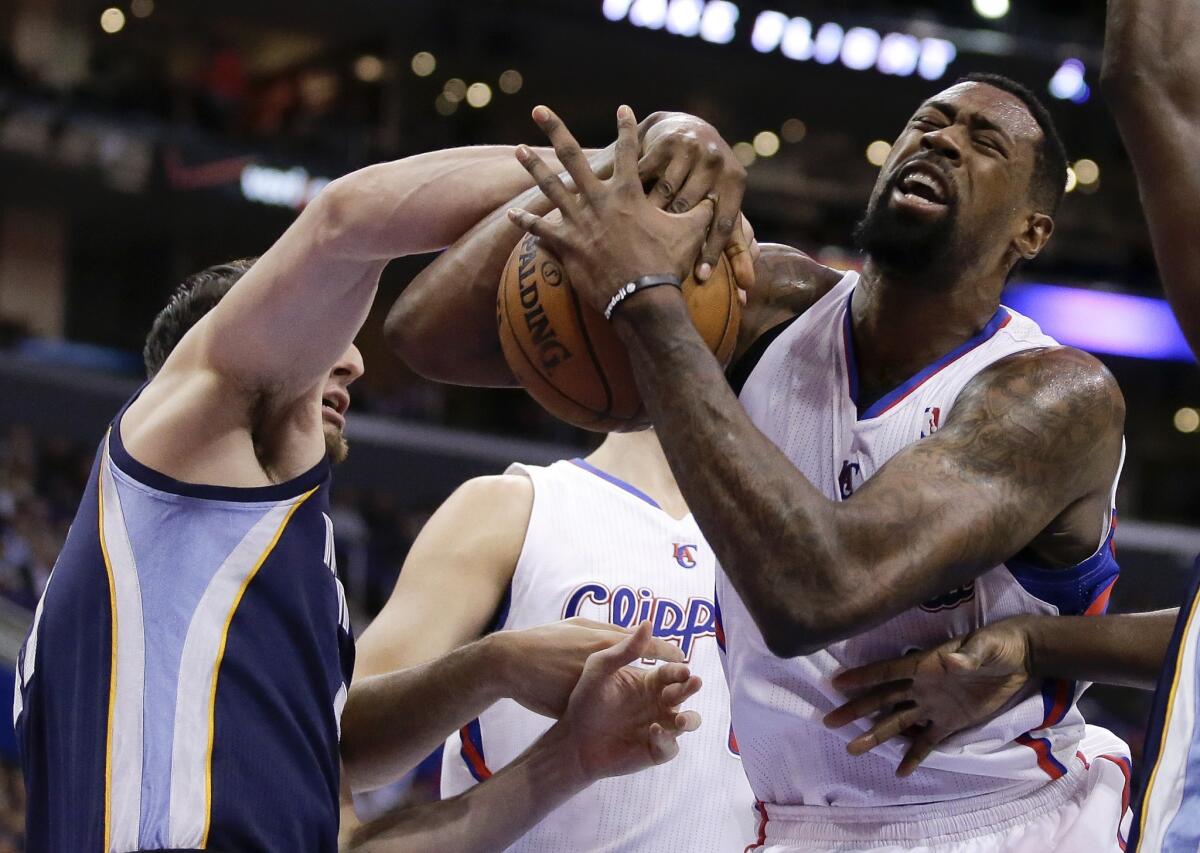
It’s a question with a seemingly straightforward answer: Who is the NBA’s best rebounder?
Kevin Love averages a league-leading 13.7 rebounds to DeAndre Jordan’s and Dwight Howard’s 13.0. Was that so hard?
Well, actually ...
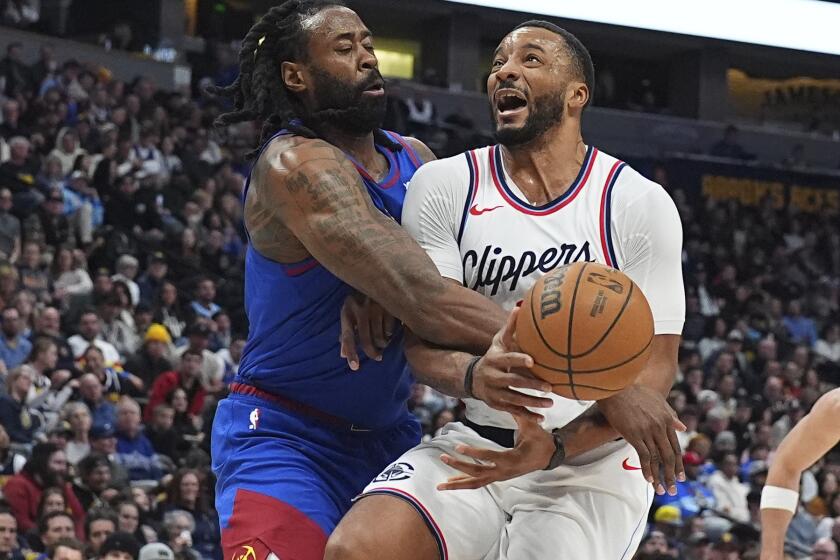
What some might consider a more sophisticated set of numbers says the Clippers’ Jordan is superior to his counterparts from the Minnesota Timberwolves and Houston Rockets.
Jordan secures 71.6% of rebounds per chance as defined by being within 31/2 feet of the ball when it comes off the rim. By comparison, Howard converts 69.5% of his rebounding opportunities and Love 65.0% of his opportunities, making them, to some, less efficient rebounders.
Maybe they all have some catching up to do.
Detroit’s Andre Drummond leads the league with 6.0 contested rebounds per game, meaning the rebounds come when an opponent is within 31/2 feet of where the ball is collected.
This is just one of the fun debates sprouting from new analytical data that can quantify almost everything that happens during a game besides how many high-fives a player produces.
Of course, that could be next.
The data is generated by six cameras that have been installed in the catwalks of every NBA arena this season for the first time. Software developed by SportVU, a subsidiary of STATS LLC, tracks the movement of every player and the ball 25 times per second, providing advanced statistics that can underscore the brilliance of the game’s best players.
Clippers point guard Chris Paul throws fewer passes (74.0 per game) than Charlotte’s Kemba Walker (76.1) but generates nearly three times as many assists (11.3 to Walker’s 4.4).
“The difference in those two numbers could be the type of shooters you’re surrounded by or the type of shots you’re getting your teammates,” said Brian Kopp, senior vice president of sports solutions for STATS. “[Walker] doesn’t have Jared Dudley and J.J. Redick out there, but he also isn’t doing lob dunks to Blake Griffin and DeAndre Jordan.”
There’s also the possibility that Paul is just better than Walker and every other point guard on the planet.
Paul leads the league with an average of 21.1 assist opportunities, which are passes to a teammate who attempts a shot, and is tops with 25.1 points created by assists per game. He’s also No. 1 in the NBA with an average of 2.2 secondary assists, which are passes made to a player who earned a subsequent assist on a made shot.
The next time Golden State Coach Mark Jackson calls Stephen Curry and Klay Thompson the greatest shooting backcourt in the history of the game, he’ll have the data to prove it.
In fact, the Warriors had it last season because they were one of 15 teams with the motion-tracking cameras previously installed in their arenas. The numbers are just as staggering this season: Curry leads the league with 14.6 points per game on pull-up jumpers and Thompson ranks first with 254 catch-and-shoot points.
Sometimes it’s just as entertaining to look for players who are categorically bad.
Plodders Andrew Bynum, Carlos Boozer and Victor Claver don’t need to worry about a speeding ticket, averaging a league-low 3.6 mph while on the court. Speedsters Patty Mills and Lorenzo Brown average a league-best 4.8 mph. And then there’s distance specialist Gordon Hayward, who has already logged a league-high 75.0 miles this season.
Only a small portion of the analytic data being generated can be viewed publicly on NBA.com, with the balance being sent directly to teams. There seems to be nearly universal interest: Page views on statistical information on the league’s website are up by more than 50% over the first two months of last season.
Golden State assistant general manager Kirk Lacob said the data underscores trends such as the continued increase in three-pointers and pace of play across the league. But there are exceptions such as Portland, which has built the NBA’s top-rated offense while taking scores of mid-range shots that are generally viewed as inefficient.
Some of the information is surprising and some of it, not so much.
“There’s things like what Indiana does — a couple of things that I won’t say,” Clippers Coach Doc Rivers said, “but when you read it, you’re like, ‘Well, no … ‘ “
It actually might qualify as news to Pacers Coach Frank Vogel, who said he hasn’t checked the data recently because “it’s secondary right now to what we’re doing.”
Some might say there are lies, damned lies and analytics.
Kendrick Perkins and Ryan Hollins are averaging 0.5 blocks and 0.4 blocks per game, respectively, but are holding opponents to a lower field-goal percentage at the rim than are Anthony Davis (league-leading 3.4 blocks) and Roy Hibbert (2.8 blocks).
Which set of players would you rather have as your last line of defense?
Agents are sure to use the analytics in an attempt to bolster their clients’ value in trades and free agency. Kopp said STATS planned to provide teams with new analysis before the February trade deadline to help them find players who fit their systems and possess previously immeasurable intangibles.
Not that Rivers will believe everything he sees.
“Agents are going to be buying all this stuff,” Rivers said, “so I’m going to have to hear all these numbers that I’ve never heard before. And I’m going to say, ‘I’m still looking at them with my eyes.’ ”
Twitter: @latbbolch
More to Read
Go beyond the scoreboard
Get the latest on L.A.'s teams in the daily Sports Report newsletter.
You may occasionally receive promotional content from the Los Angeles Times.
