L.A. Now Live: Discuss changes to The Times’ Homicide Report
Over the weekend The Times launched a new and improved version of the Homicide Report, which has tracked every homicide in Los Angeles County since 2007. The latest iteration combines the best pieces of the map, database and blog to give readers a better sense of who is being killed in Los Angeles, and where.
Discuss the changes to the Homicide Report with Times staffers Nicole Santa Cruz and Ken Schwencke at 9 a.m. Monday.
Homicide Report: A story for every victim
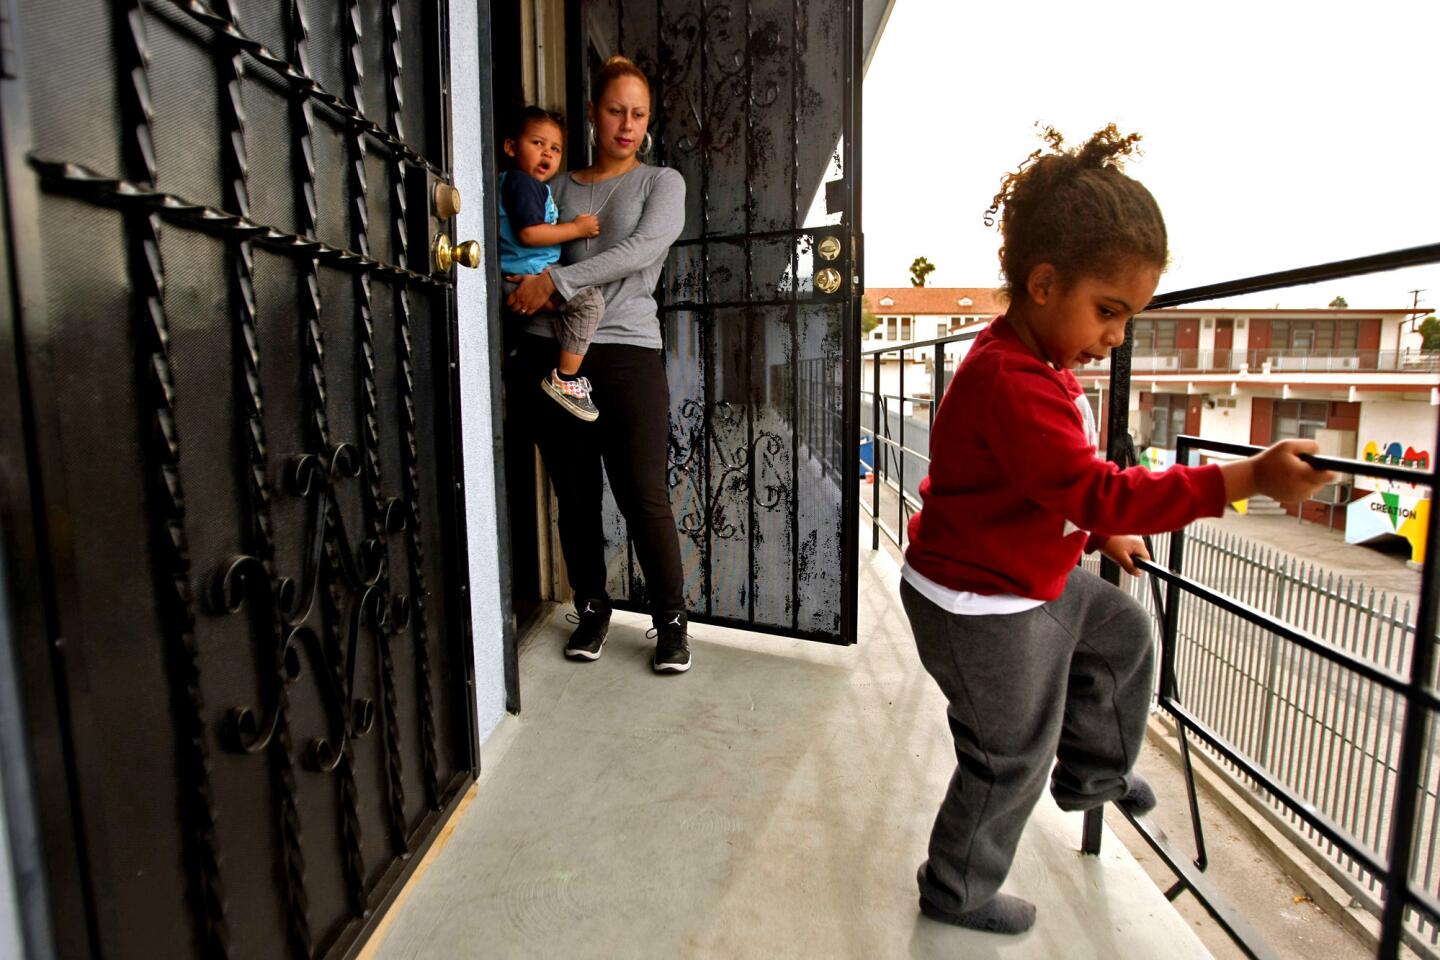
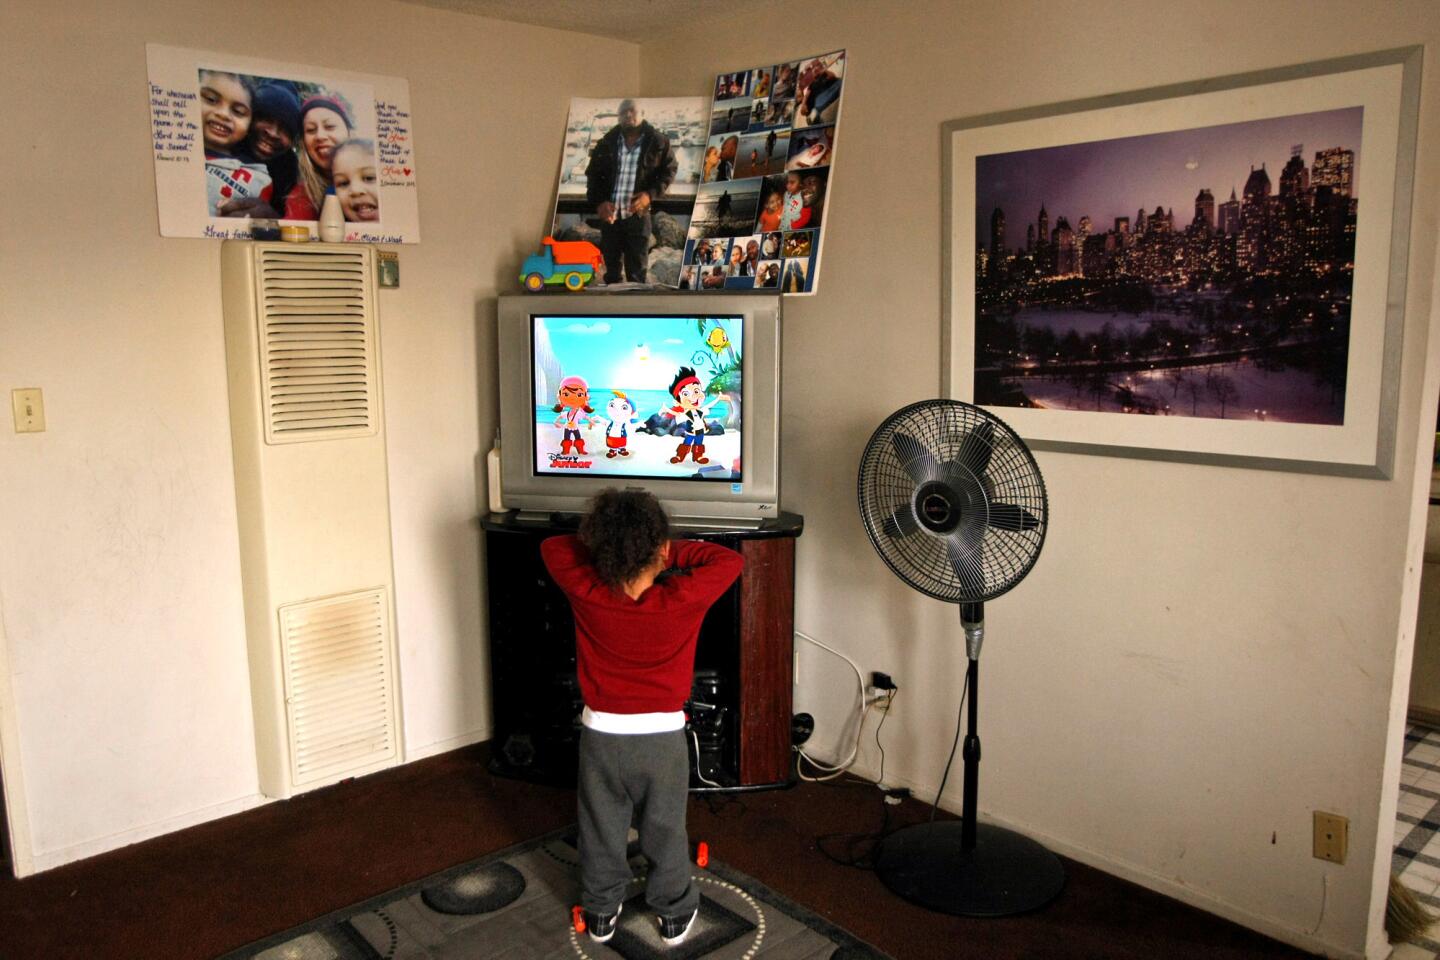
Since 2007, the blog has recorded more than 5,200 killings in Los Angeles County with in-depth as well as bare-bones posts. Reporters have documented the lives of family members left behind, detectives on the street, gang interventionists, suspects’ trials and more.
Now, updates on older cases will be easier to find, with posts about an individual case collected and available both from the new posts and from the older ones. Reader can compare neighborhoods with a new tool that takes into account size and population density, and filter the database to find information on any combination of race, gender, cause of death and neighborhood.
MORE: South Vermont Avenue: L.A. County’s ‘death alley’
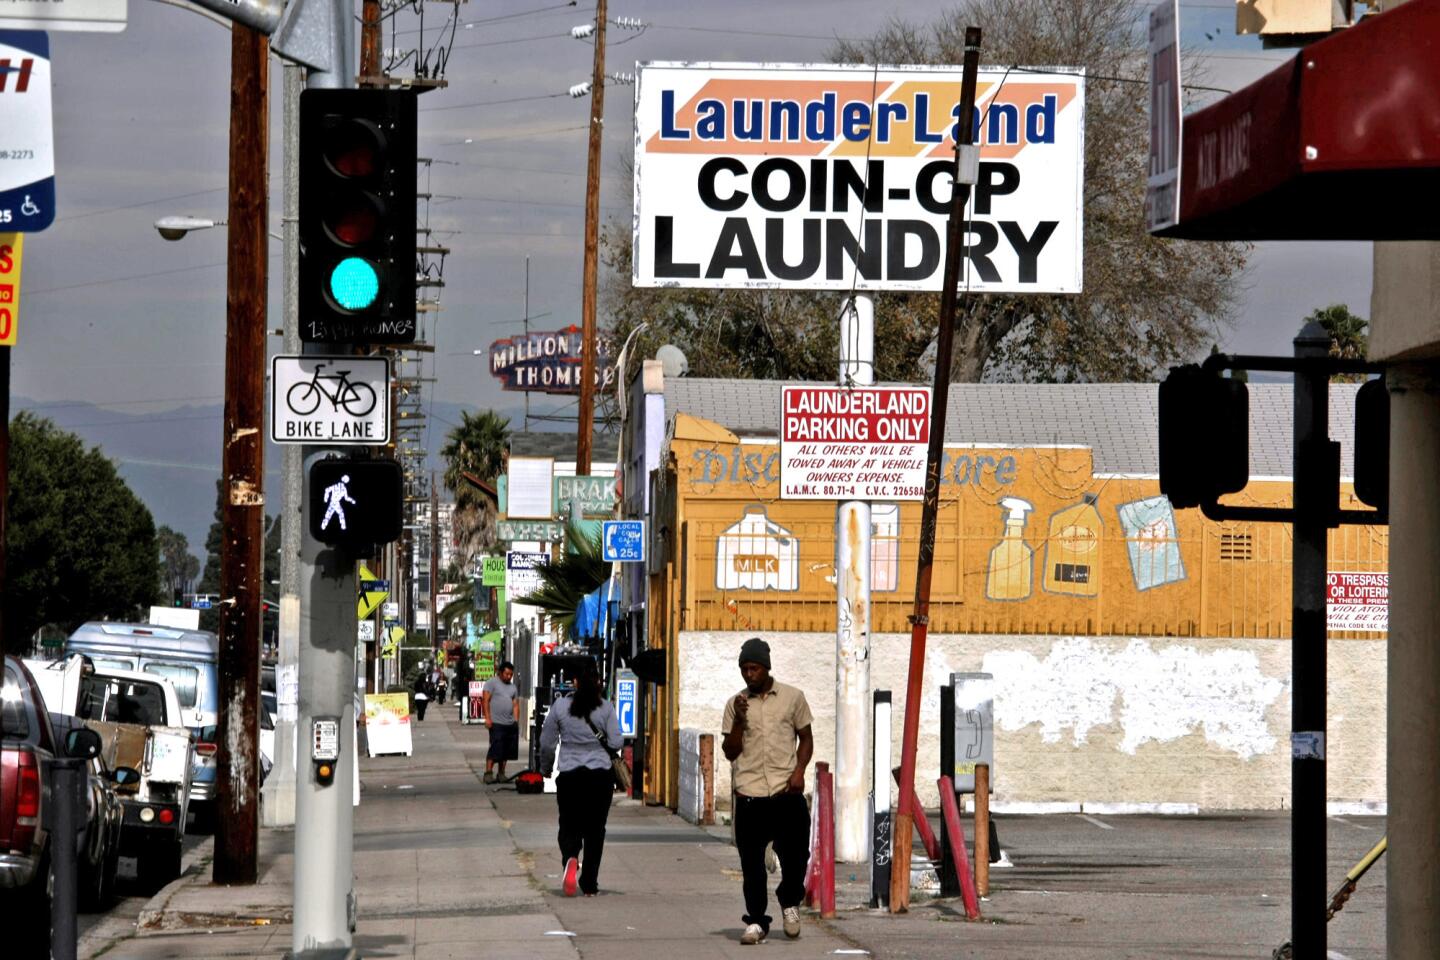
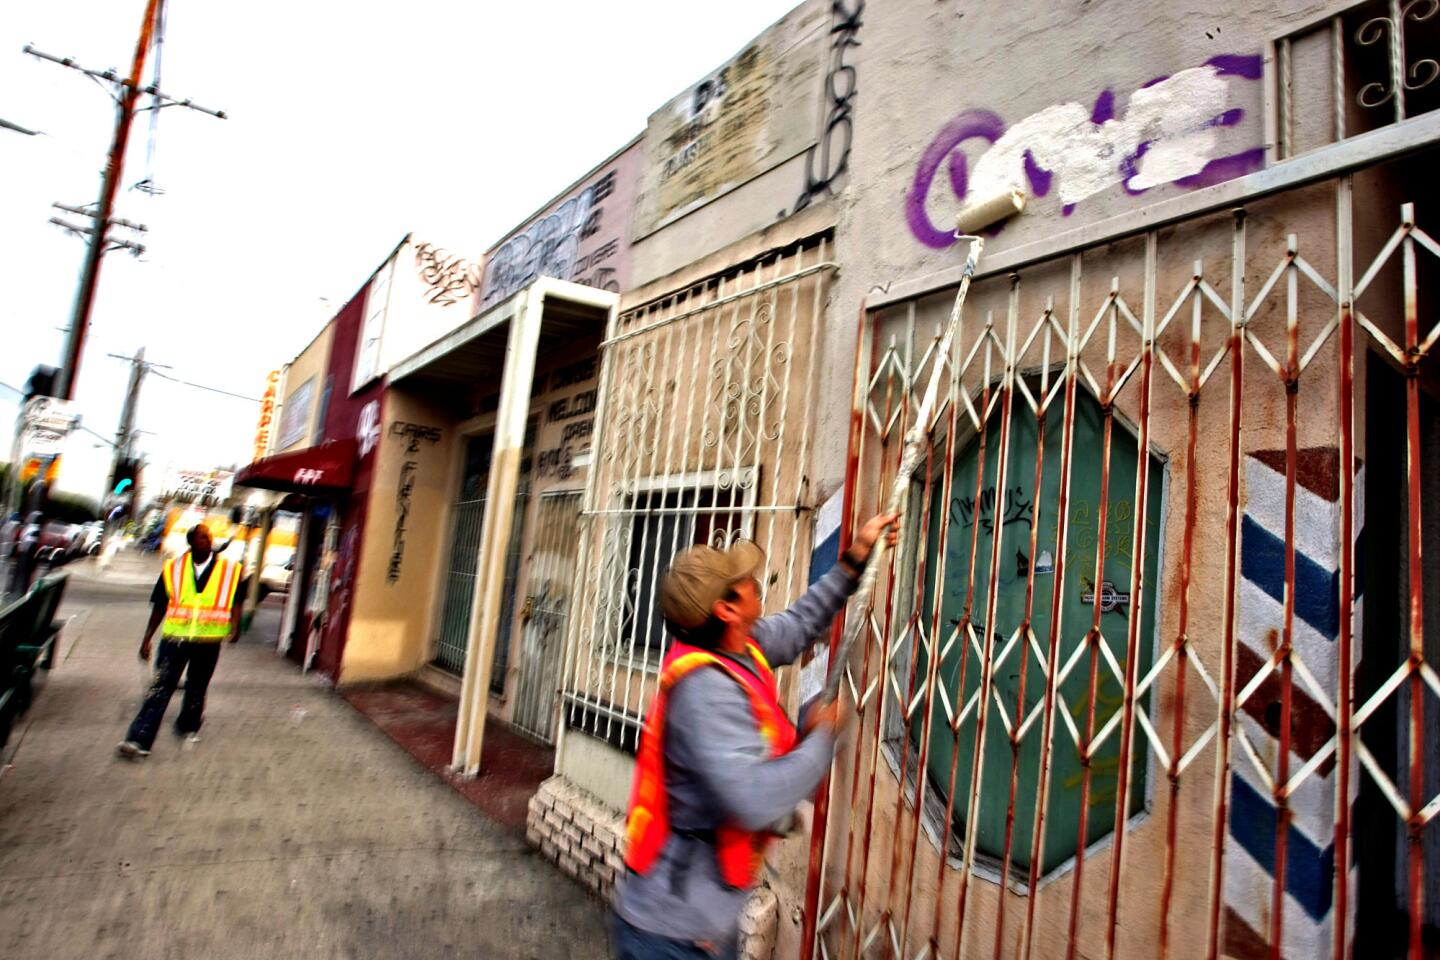
In an analysis published in The Times on Sunday, Santa Cruz and Schwencke looked at “death alley,” two miles near South Vermont Avenue where 60 people have been killed since 2007, most of them shot. The area is the border of the Westmont and Vermont Vista neighborhoods.
In a county of 10 million people, Westmont is among the deadliest places to live. In the last seven years, 100 people — nearly all of them male — have been killed in the 1.8 square miles wedged between the city of Los Angeles and Inglewood. A Times analysis of homicide data collected in that time found Westmont’s rate of killings to be the highest overall.
Submit your questions and comments about the blog, and join the conversation at 9 a.m.
More to Read
Sign up for Essential California
The most important California stories and recommendations in your inbox every morning.
You may occasionally receive promotional content from the Los Angeles Times.
