In California, national test scores show enduring achievement gaps
- Share via
Every two years, the nation’s fourth- and eighth-graders are tested in math and reading — and newly released results from last year’s tests give California at least a little reason to be pleased.
The 2017 results — out Monday night — were mostly flat nationwide, though the average score in eighth-grade reading went up.
But while that improvement largely came from the increased scores of the highest-performing students, California eighth-graders showed some reading progress from the lowest levels to the highest.
Educators have been fretting about the National Assessment of Educational Progress — known as NAEP — since 2015, when scores stagnated after a long period of slow but steady gains.
Even the slight progress in eighth-grade reading nationwide this time was not across the board.
“The performance of lower-performing students stayed about the same,” said Peggy G. Carr, the associate commissioner of assessment at the National Center for Education Statistics, the U.S. Department of Education’s research office.
California, though, had “a success story across the distribution” of students in eighth-grade reading, said Jack Buckley, a senior vice president at the American Institutes for Research, who previously led the National Center for Education Statistics, which oversees the test.
Interpreting the scores
California was one of just 10 states to post statistically significant increases in eighth-grade reading.
In 2015, the average reading score for California eighth-graders was 259 on the 500-point test. In 2017, the average was 263.
Ryan Smith, executive director of the Education Trust — West, an Oakland-based nonprofit that fights for educational equity, partially credited the effects of the state’s Local Control Funding Formula, which aims to give schools extra resources for the neediest students.
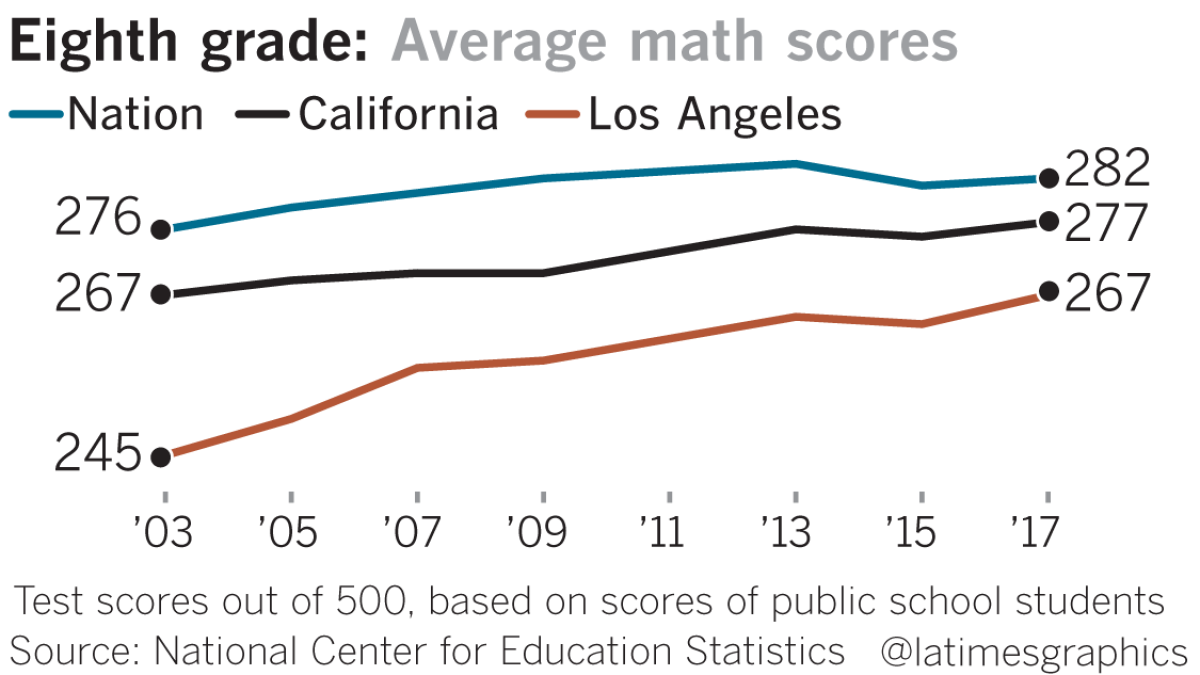
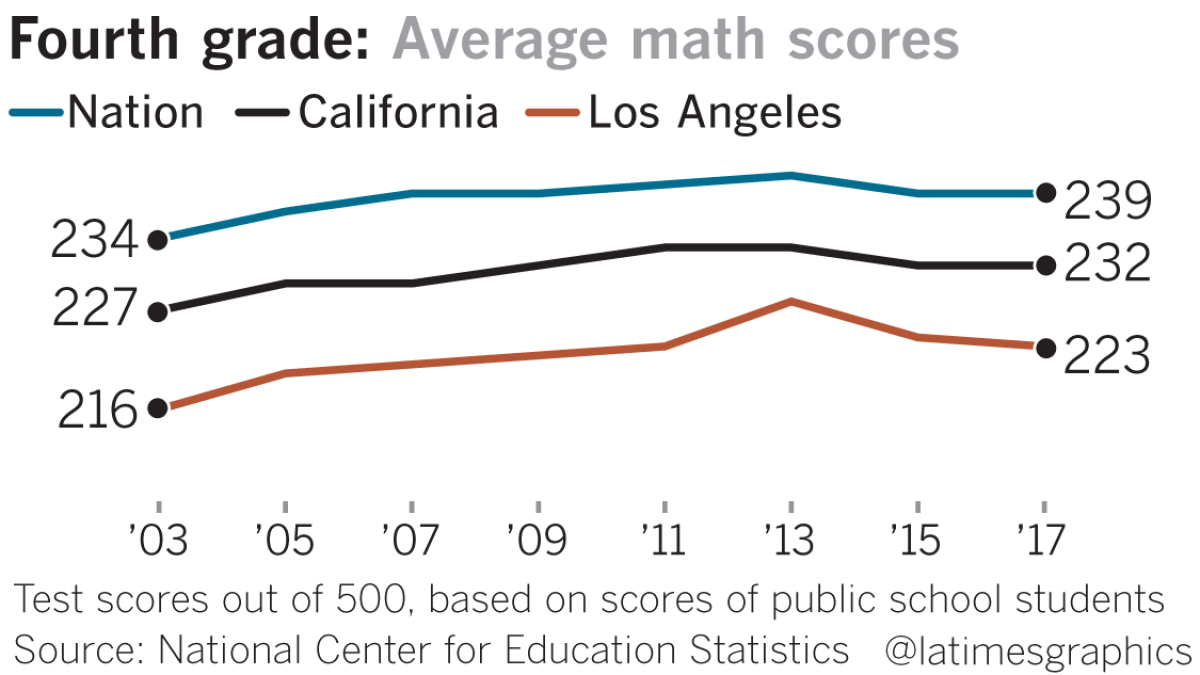
“It’s showing California’s efforts to provide more resources have given [students] some gains,” he said.
Otherwise, the state’s scores on the test were flat, which the state Dept. of Education downplayed.
Robert Oakes, a department spokesman, said of the test: “We do not believe it is the best measure of success because it is not aligned to California standards.”
Big achievement gaps remain
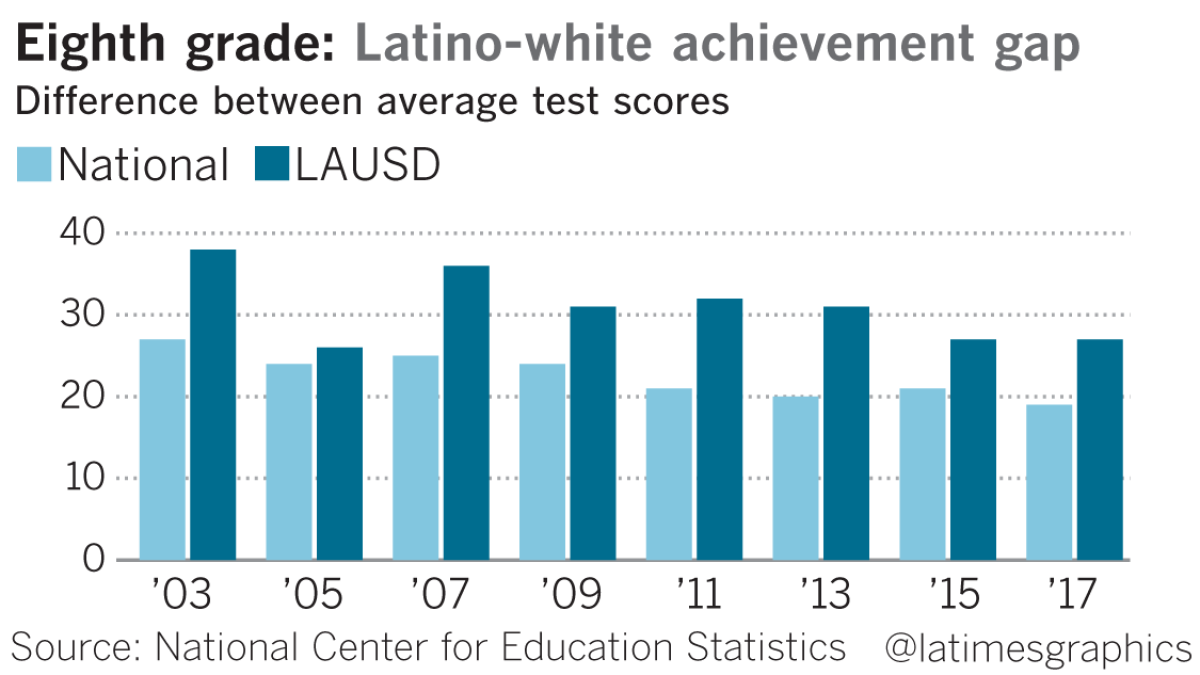
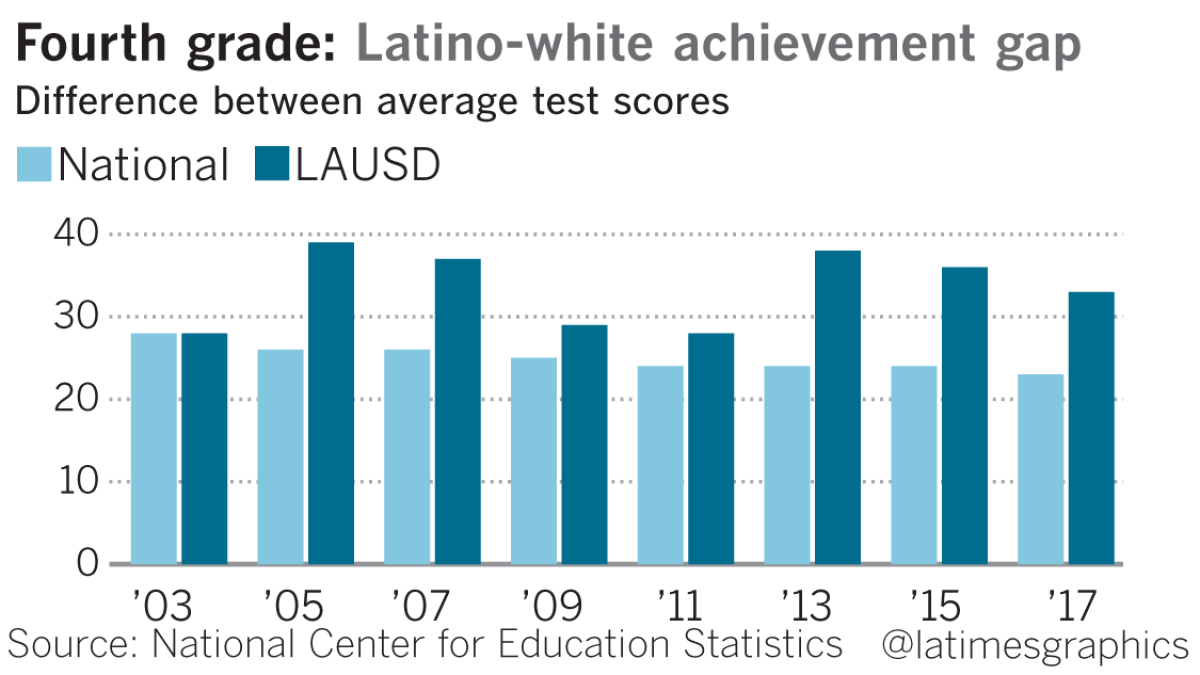
Gaps between different racial groups remained wide both nationally and in California. In L.A. Unified, only 13% of black students met or exceeded proficiency goals in fourth-grade reading, compared to 51% of white students and 23% of students overall. In California, only 10% of black students and 15% of Latino students met those benchmarks in eighth-grade math, compared to 44% of white students and 29% of students overall.
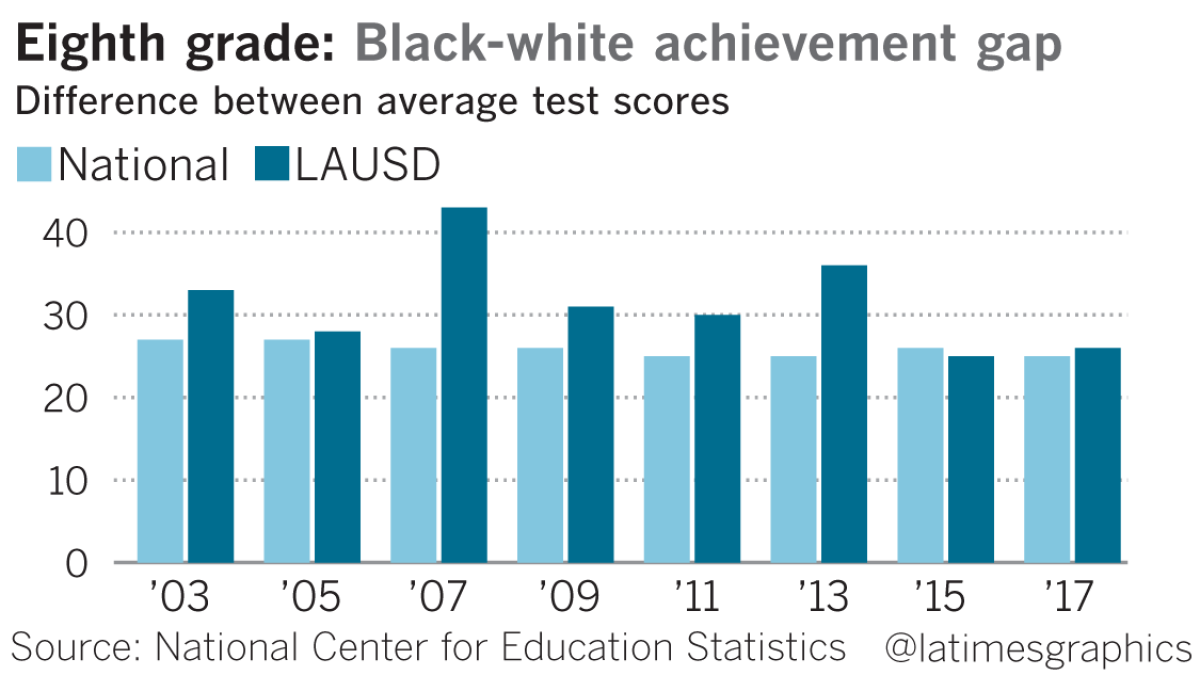
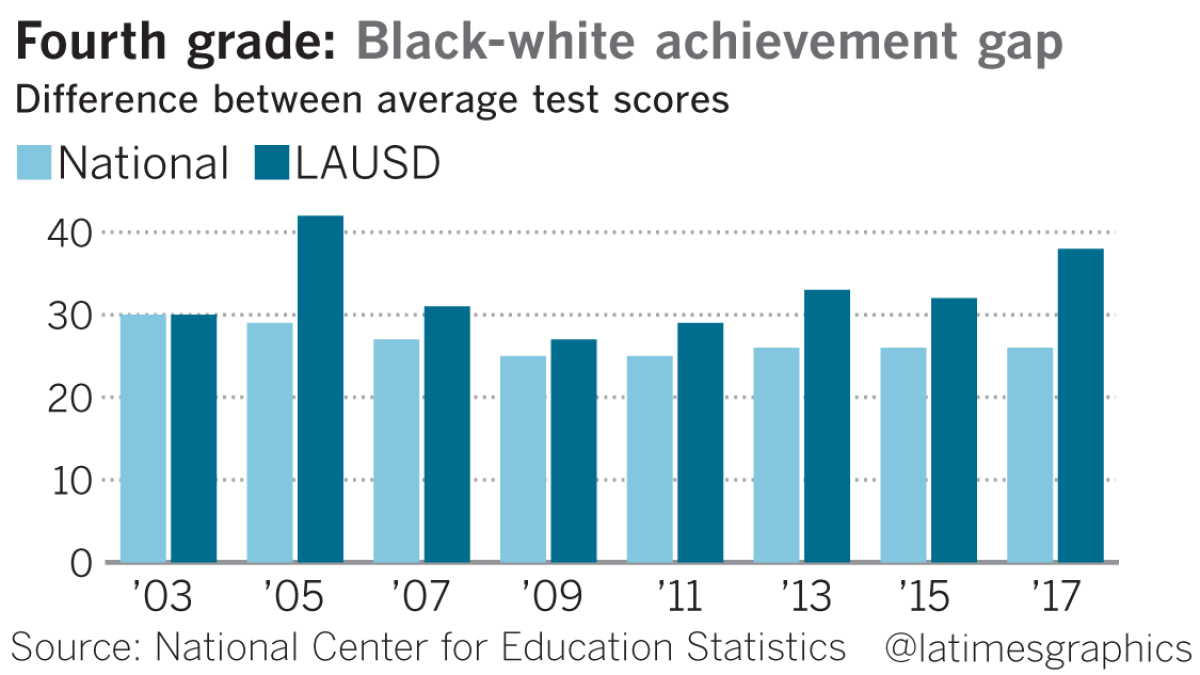
“This is a wake-up call that we need to do more to put equity at the center of the discussion,” Smith said. “We have to start putting our actions where our words are. I’m concerned that California claims to be a beacon on the hill and yet still leaves black and Latino students languishing on the sidelines.”
Tested on tablets
The national exam generally is considered the gold standard of educational measurement, in part because it has no consequences for individual students, schools and teachers, so there’s less incentive to try to game it by spending hours on test-prep drills. In states such as California, where many districts are posting higher and higher graduation rates, it can also be a reality check.
Last year was the first time the test was administered digitally, with 298,000 fourth-graders and 268,800 eighth-graders in public and private schools nationwide logging their answers on tablets.
Southern California’s scores
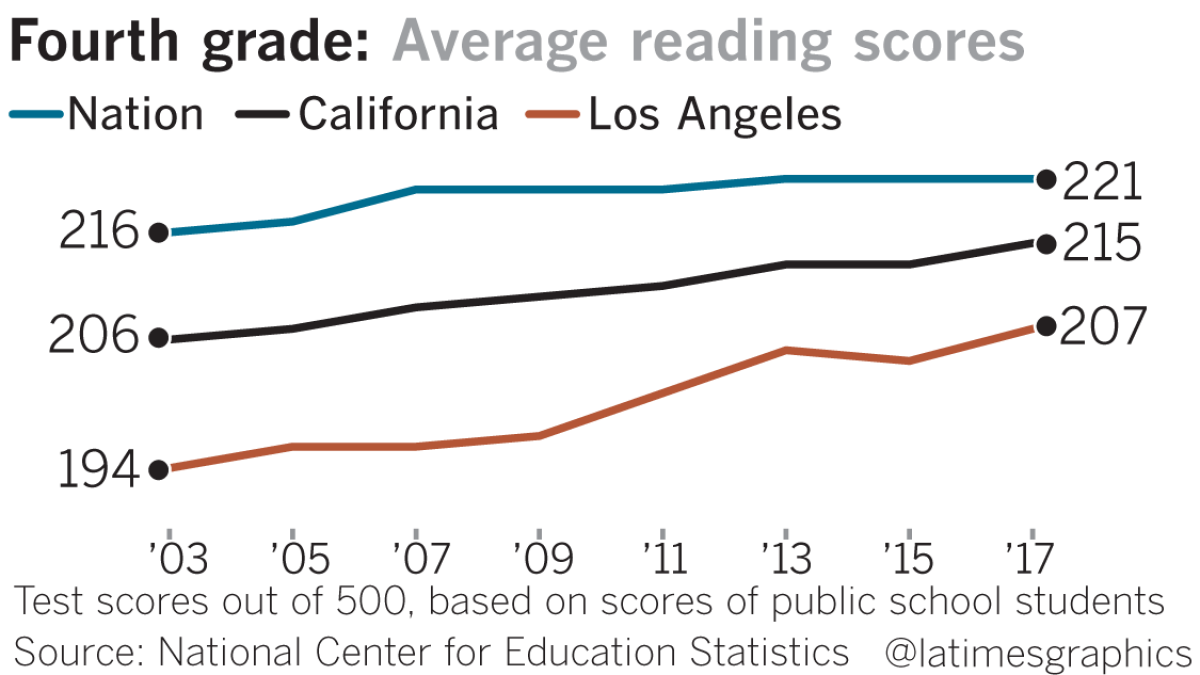
In L.A. Unified, average scores increased by a few points between 2015 and 2017 in all areas except fourth-grade math, but the federal government judged those small increases to be statistically insignificant.
“In comparing ourselves to other districts, we did fairly well,” said Oscar Lafarga, executive director of LAUSD’s office of data and accountability. Students with disabilities and English learners, he said, saw some higher scores.
In eighth-grade math, though, the performance gap between white and Latino students widened between 2015 and 2017.
“All gaps … are concerning,” Lafarga said.
But where the lowest-performing students in California and the nation overall largely posted lower scores in 2017 than their peers in 2015, L.A.’s bottom scorers held steady and even posted higher scores.
There was good news for San Diego, too, where fourth-graders’ average scores went up in both subjects.
Sign up for Essential California
The most important California stories and recommendations in your inbox every morning.
You may occasionally receive promotional content from the Los Angeles Times.


