Growing signs Omicron is leveling off in California

While California continues to see disturbing rises in COVID-19 hospitalizations and deaths, there are some early signs the unprecedented Omicron wave is slowing.
The shift is uneven across the state, but the numbers suggest California could be reaching a crest in the latest surge. States on the East Coast that were hit earlier by the Omicron wave have already started to see a sustained decline in infections.
California has recorded more than 7 million coronavirus cases as of this week. The tally, recorded in the state’s databases late Monday, comes one week after it recorded its 6 millionth coronavirus case. Officials are urging people to do what they can to avoid infection, as there have never been as many Californians simultaneously infected in the history of the 2-year-old pandemic.
A leading World Health Organization official says the worst of the COVID-19 pandemic — including deaths, hospitalizations and lockdowns — could be over this year if huge inequities in vaccinations and medicines are addressed quickly.
Here are what the numbers show:
Cases still high but leveling
The exponential growth in California’s case rate appears to be leveling off, although it probably will take a few days — following any reporting backlog from the Martin Luther King Jr. holiday weekend — to be sure.
According to data released Wednesday that reflect numbers through Tuesday, California was averaging 103,000 cases a day for the most recent seven-day period, slightly below the prior week’s rate of 107,000; the week before, the state was reporting 60,000 cases a day. California’s case rate fluctuated between 114,000 and 115,000 in the last few days — the highest rates of the pandemic.
Some of the state’s most populous regions may be starting to see a leveling in case rates. Southern California recorded 69,000 new cases a day over the most recent seven-day period, a slight reduction from the 75,000 recorded from a week earlier. The week before, the region tallied 43,000 cases a day.
The fast-moving Omicron variant may cause less severe disease on average, yet COVID-19 deaths in the U.S. are climbing.
L.A. County
Los Angeles County posted a record number of coronavirus cases last week, nearly 42,000 a day. But based on numbers released through Wednesday afternoon, the county is now averaging about 37,000 cases a day.
Bay Area
The greater San Francisco Bay Area is now averaging about 18,000 coronavirus cases a day, a rate that has fluctuated between 18,000 and 22,000 for roughly a week and a half.
In Santa Clara County, coronavirus levels in wastewater started declining about 1 1/2 weeks ago. Officials expect the dip will presage a sustained decline in coronavirus cases.
Central Valley
The Greater Sacramento area recorded about 5,400 cases a day for the most recent weekly period. The capital region has been fluctuating between 5,000 and 6,000 cases a day for the last week and a half.
In the Greater San Joaquin Valley, a region that generally lags behind trends in Southern California and the Bay Area, cases are still going up. The area tallied 9,300 cases a day over the last week, higher than the 7,100 cases a day for the prior week; the week before that, the region recorded 3,200 cases a day.
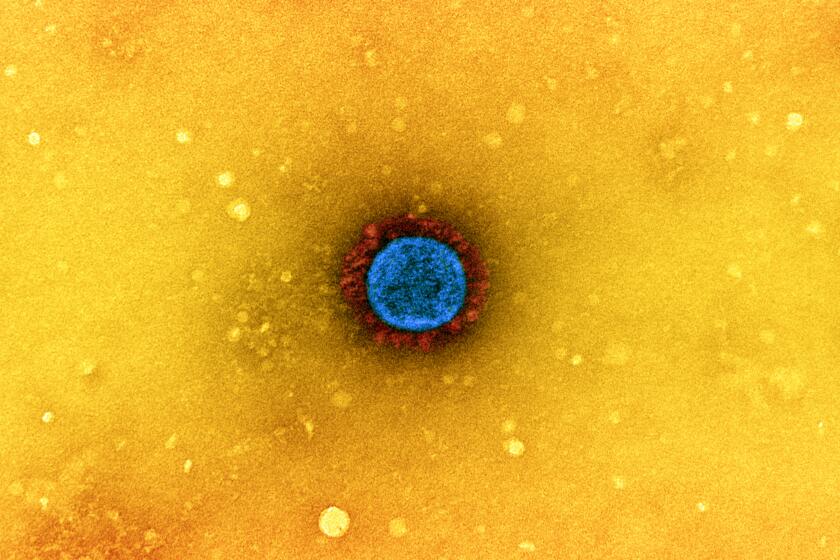
When the coronavirus attacks the body, the immune system steps up, trying to respond quickly and powerfully enough to stop the virus from running wild.
Rural Northern California
In rural Northern California, about 720 cases a day were reported in the last week, nearly even with 710 reported the week before, but more than double the roughly 350 cases a day the sparsely populated region reported the prior week.
Positive coronavirus test rate declining
The rate at which California’s coronavirus tests are coming back positive has also started to decline. For the seven-day period that ended Jan. 10, California hit a record positive test rate of 23.1%. Since then, the rate fell to 21.1% for the seven-day period that ended Sunday. The rate is still very high; by comparison, in early December, it was around 2%.
A similar trend is holding for Los Angeles County. L.A. County’s seven-day positive result rate may have peaked at 22.7% for the seven-day period that ended Jan. 3; for the weekly period that ended Wednesday, the positivity rate was 16.9%. In the first week of December, it was around 1%.
Hospitals
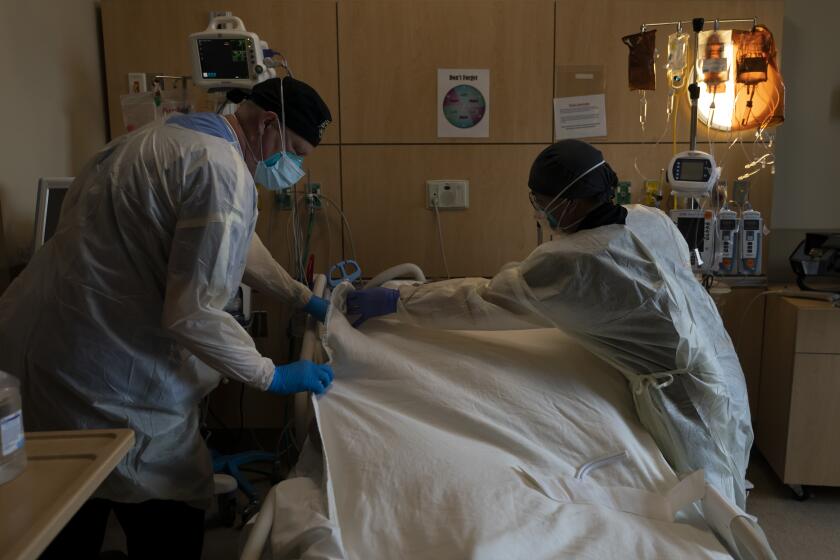
There are also signs that coronavirus-positive hospitalizations, though not yet declining, are growing at a slower rate than seen earlier in the surge.
As of Tuesday, 15,179 such patients were hospitalized statewide, state data show.
From Dec. 28 to Jan. 4, that census swelled 69%. The next week, it rose 53%.
However, the growth from Jan. 11 to Tuesday was far more modest: about 23%.
Even so, the latest count is the highest since Jan. 29, 2021 — and represents a significant strain on the state’s healthcare system. The number is nearly double the summer surge’s peak of 8,353 and nearly 70% of last winter’s peak of 21,938.
Intensive care units
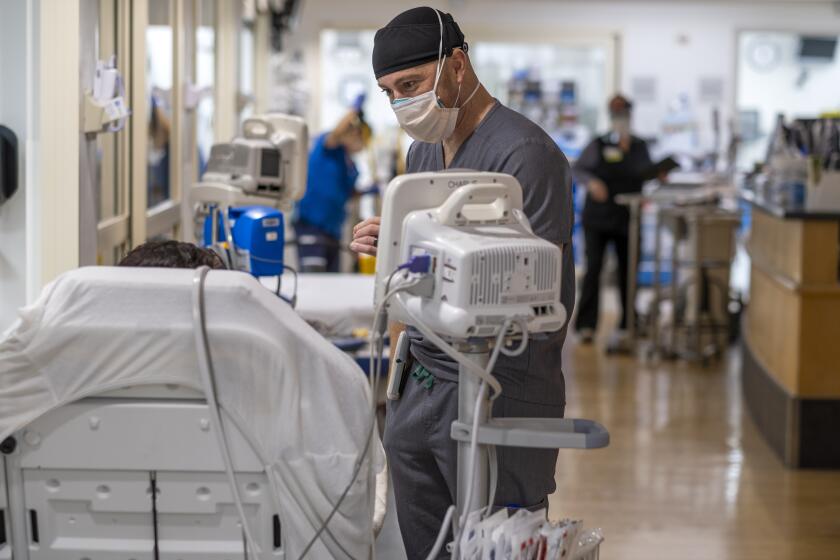
The number of coronavirus-positive patients in intensive care units is still increasing, though it’s growing at a slower pace.
As of Tuesday, 2,404 patients were in California ICUs. From Dec. 28 to Jan. 4, that census rose 35%. The next week, it rose 37%.
But the growth from Jan. 11 to Tuesday was milder: 26%.
The latest tally is the highest since Feb. 17, 2021, and exceeds the peak from the summer surge, which maxed out at 2,128. It’s about about half of last winter’s peak of 4,868.
Last week, California averaged 52,000 hospital patients daily, just under the 55,000 hospitalized for all reasons during last winter’s COVID-19 surge.
Forecast
The University of Washington’s Institute for Health Metrics and Evaluation model projects that the daily number of Californians infected — including those who aren’t getting tested — peaked in early January, around the same time emergency room visits for coronavirus-related concerns reached an all-time record. The model suggests that by mid-February, new infections could be 7% of the levels from early January — about the same as early December.
The California COVID Assessment Tool, a website published by the state Department of Public Health, estimates that the state’s effective transmission rate is now 0.96 — meaning every infected Californian is on average transmitting the virus to fewer than one person, suggesting coronavirus spread is likely stable and no longer accelerating. A rate of substantially less than 1 means the spread of the virus is decreasing.
Even once the infection trend reverses, it will still take weeks for the full fury of the Omicron wave to dissipate. Throughout the pandemic, officials have noted that a rise in cases will invariably trigger corresponding increases in COVID-19 hospitalizations and deaths a few weeks later. The institute, for instance, estimates the number of hospitalized coronavirus-positive patients will peak at the end of January.
Deaths
Deaths are still climbing. As of Wednesday night, L.A. County was averaging about 48 COVID-19 deaths a day over the past week, about double from the prior week, when it was 22; the week before that, it was 14.
California is averaging about 95 COVID-19 deaths a day. For the weekly period that ended Jan. 4, the state was averaging 61 deaths a day.
More to Read
Sign up for Essential California
The most important California stories and recommendations in your inbox every morning.
You may occasionally receive promotional content from the Los Angeles Times.

