We used a 3-D printer to map the power of the Ridgecrest earthquake

- Share via
Numerous maps have been created to show the power of the magnitude 7.1 earthquake that hit Ridgecrest this month.
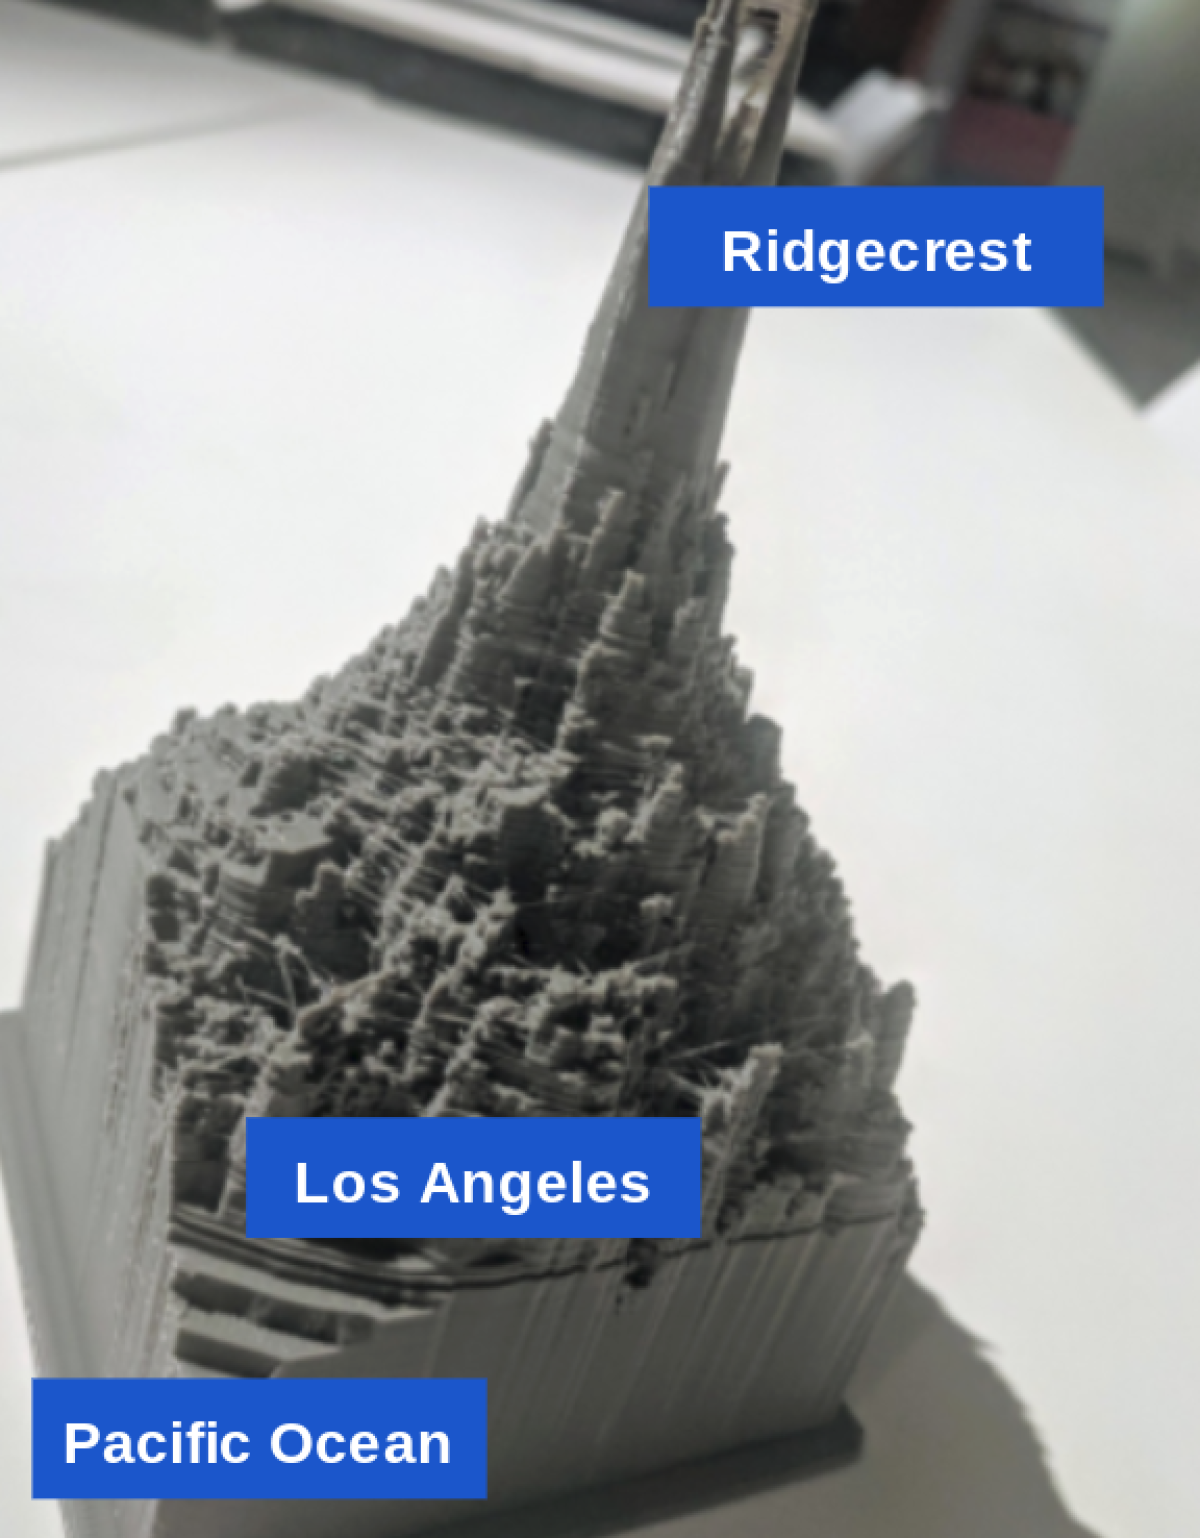
But to better understand the biggest quake to hit Southern California in nearly two decades, we used a 3-D printer to produce a 3-D map of the shaking intensity across a wide swath of Southern California.
Ben Welsh, The Times’ Data Desk editor, is the mastermind behind this exquisite piece of science. He relied on the U.S. Geological Survey’s map of shaking intensity, typically seen on the agency’s website as colorful rings — with red describing violent or extreme shaking (level 9 or 10 on the Modified Mercalli Intensity Scale) and weak and light shaking as aqua or turquoise (level 3 or 4).

The result is a work of art — twin peaks of violent (level 9) shaking at the center, separated by, say, 20 miles — looking a bit like the Dark Lord Sauron’s evil stronghold of Barad-dûr in Mordor, featured in the “Lord of the Rings.”
The sharp peaks quickly dive in elevation — showing how just being a bit away from the ruptured fault’s path can provide a lot less shaking.
Ridgecrest got severe shaking (intensity level 8), and Trona received strong (intensity level 7). (Ridgecrest was helped by its relatively new building stock; Trona suffered more because it sits on soft sediments that acted like quicksand when shaken.)
Compare that to what the San Fernando Valley endured in the magnitude 6.7 Northridge earthquake in 1994: A wide swath of the Valley got violent (intensity 9) shaking — worse than what Ridgecrest or Trona got.
The Valley was hit harder because a huge section was right on top of the ruptured fault, which was more horizontal than vertical. And the fault was on a slant, with the rupture starting deepest under Northridge and heading to its shallowest under the interchange of Interstate 5 and Highway 14.
On July 5, Los Angeles was much farther away from the ruptured fault, roughly 125 miles from the epicenter. That’s why Angelenos got much gentler shaking — weak or light (level 3 or 4) — scary, but generally not so bad as to cause damage.
Welsh thought it might be fun to print out this map in 3-D using the Los Angeles Public Library’s new Octavia Lab, which features a 3-D printer. (The lab’s name honors the late bestselling author Octavia Butler — a black woman praised for her novels in the genre of science fiction.)
“What do you think, nerds, can I get a 3D printer to grind this out? I’ve been looking for an excuse to make something at @laplcentral‘s new Octavia Lab,” he tweeted.
He grabbed vector shapefiles, converted them into something called a rasterized .tif file, and then converted them into a 3-D .stl file. More pixie dust was still needed, including compressing them down. At a final stage, he had to drastically simplify his model from what he said were 250,000 triangles down to 20,000.
Finally, the programming clicked. A glowing machine at the library began making the image you see before you.
“We did it, guys. The @USGS shakemap of the 7.1 magnitude July 5 earthquake printed in 3D. Total cost: $0.00. All thanks to the free resources at @laplcentral’s Octavia lab.”
Welsh placed a copy of his source code and files up on a public website, Github, for anyone else to try.
More to Read
Sign up for Essential California
The most important California stories and recommendations in your inbox every morning.
You may occasionally receive promotional content from the Los Angeles Times.


