L.A., O.C. still have the worst traffic
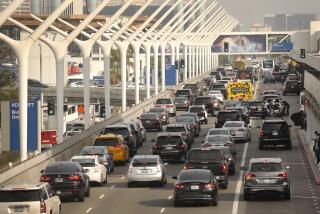
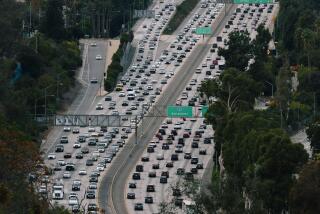
Los Angeles and Orange counties have retained their infamous reputation as the worst region in the nation for traffic delay, although the area appears to be holding the line on congestion, a new national study shows.
But the findings of the Texas Transportation Institute were immediately challenged Tuesday by some experts who warned that the study significantly underestimates the severity of the region’s traffic congestion.
The intense debate over statistics reflects the enormous influence of chronic traffic congestion on the lives of Southern Californians and the tough policy decisions that must be made to combat it.
The Texas report says motorists in Los Angeles and Orange counties spent an average of 72 extra hours in rush-hour traffic in 2005, the subject of the current study. That’s one day shy of two full workweeks a year and is 20 hours more than in 1985. The delay represents the difference between how long it takes to travel during peak periods compared with hours when traffic flows freely.
“L.A. is still the king of congestion,” said David Schrank, co-author of the institute’s Urban Mobility Report.
In the fast-growing Inland Empire of Riverside and San Bernardino counties, the study shows, the traffic delay is dramatically worsening and is beginning to approach Los Angeles-style congestion.
Drivers in the Inland Empire wasted an average of 49 extra hours stuck in peak-period traffic during 2005. But the increase since 1985 -- a stunning 40 extra hours -- is twice what Los Angeles-area motorists experienced.
Traffic delay in the Oxnard-Ventura area hit 39 hours in 2005, almost five times more than the eight hours in 1985, according to the institute, which is based at Texas A&M; University.
Although Los Angeles and Orange counties remain the worst area in the nation for traffic delay, an official of the Southern California Assn. of Governments, the regional planning agency for six counties, sharply criticized the Texas findings.
The study “does a great disservice to the state and the region,” said Hasan Ikhrata, the organization’s director of planning and policy. “I would not make policy decisions based on their data, period.”
Ikhrata contends that the new method used by the institute mistakenly assumes that traffic in Los Angeles County, Orange County, the Inland Empire and Oxnard-Ventura is moving much faster during rush hours than it actually is.
Texas researchers assumed that traffic is traveling at an average of 35 mph during peak travel times. However, SCAG planners say that sensors buried in the pavement of major freeways in the Los Angeles area show that the average speed during rush hours is closer to 20 mph. By this measurement, Ikhrata said the extra delay is roughly 100 hours per year, nearly 40% worse than the Texas estimate.
Ikhrata said the actual data, collected from the sensors by the state Department of Transportation, indicate that all of the Los Angeles region’s major freeways have segments moving at less than 10 mph during the most heavily traveled part of the long morning and evening peak periods.
For more than two decades, the Texas Transportation Institute has prepared annual reports that assess traffic trends across the country and rank urban areas based on delay. It is one of several measures used to gauge congestion.
In previous years, the Texas researchers calculated the amount of delay by assuming that traffic moved about 20 mph in the peak period. This year, they scrapped that approach and substituted 35 mph, which they believe better reflects actual highway conditions in 437 cities and metropolitan areas across the nation.
Schrank said the change in approach also reflects improvements in highway operations and changes in the way motorists drive. He said drivers today leave far less distance between vehicles.
As a result of the change in assumptions, the hours of delay in Los Angeles and Orange counties dropped from 93 hours in 2003 under the old approach to 72 hours in 2005. In the Inland Empire, the delay decreased from 55 to 49 hours.
But Ikhrata said “the average is misleading” because between 2000 and 2005 “our congestion increased tremendously.” He said using an average delay per year for a region as vast as Los Angeles and Orange counties does not reflect the experience of motorists, particularly in highly congested corridors.
Martin Wachs, a transportation expert at Rand Corp. in Santa Monica, agreed that average delay is not the best measure of what motorists are experiencing. “I am not interested in arcane indices,” Wachs said. “I am interested in travel time.”
“Traffic congestion is worsening gradually and steadily in the Los Angeles metropolitan area and most other large American cities,” said Wachs, who headed the transportation research centers at UC Berkeley and UCLA for decades.
He had not reviewed the latest Texas study and did not comment directly on its findings, other than to say: “Some will find fault with their methodology.”
Alan Pisarski, a transportation expert and author of “Commuting in America,” a national study done by the Transportation Research Board, defended the Texas study.
“This is the definitive statement on congestion across the country,” said Pisarski, whose own work has found increasing congestion and delay. He said the institute’s new methodology relies on more up-to-date information and more accurately reflects urban growth as well as improvements in highway conditions.
Texas researchers said delay in Los Angeles and Orange counties has remained fairly constant, fluctuating between 67 hours and 72 hours since 1995. The rate of growth in congestion over the last decade has been controlled through a variety of means: expanding highways, adding transit service and sharpening road management skills.
“L.A. still needs to do a lot of work,” Schrank said. “But if you just look at the measures over the last 10 years or so, L.A. has been doing a pretty good job of adding enough capacity, adding operational improvements and adding public transportation to somehow hold the line.”
The study attributed almost half of the delay in the Los Angeles area and the Inland Empire to traffic incidents, including accidents. Such incidents caused 54% of the delay in the Oxnard-Ventura area.
Four California areas now rank among the top 10 worst areas for delay in the country. Los Angeles-Long Beach-Santa Ana was first. San Francisco-Oakland came in second, San Diego sixth and San Jose eighth.
Caltrans officials refused to be interviewed about the Texas study, saying they had not been provided a copy of the report before it was released. However, Texas researchers relied on data collected by Caltrans for their analysis of traffic congestion in California.
Instead, Caltrans Director Will Kempton issued a statement repeating the arguments that Gov. Arnold Schwarzenegger made last year while pushing for voter approval of nearly $20 billion in transportation bonds.
The Automobile Club of Southern California used the occasion of the report’s release to unveil a website designed to pressure the governor and state lawmakers to stop diverting transportation funds to other uses, as was done with $1.3 billion last month in the new state budget.
Transportation officials in Los Angeles and Orange counties found much to like in the Texas study.
The report “still has us on top but acknowledges that we have done a solid job of curbing congestion over the years,” said Paul Taylor, deputy chief executive of the Orange County Transportation Authority.
Taylor said Orange County, which has increased its highway system by about 30% since 1990, accounts for much of the reduction in the growth of congestion in the Los Angeles region.
Roger Snoble, chief executive of the Metropolitan Transportation Authority, said the study validates the steps taken in Los Angeles County. Those measures include expansion of rail lines, bus service, carpool lanes, synchronizing traffic signals and deploying a large fleet of tow trucks to clear accidents.
“It takes a whole toolbox,” Snoble said.
Nationally, the study shows that delay caused by rush-hour traffic has steadily risen from an average of 14 hours in 1982 -- the first year of the study -- to 38 hours in 2005.
Riverside and San Bernardino counties placed 13th in the nation in 2005, up from 52nd in 1985. Both counties have experienced explosive population growth since 1990 and a lack of investment in highways and transit.
“With the huge growth that the Inland Empire is experiencing, we are not surprised by this report’s findings,” Mike Perovich, who heads the Caltrans Inland Empire district, said in a statement.
Transportation officials in San Bernardino and Riverside counties say substantial investments are under way to help reduce congestion, including a massive interchange project in downtown Riverside.
--
More to Read
Sign up for Essential California
The most important California stories and recommendations in your inbox every morning.
You may occasionally receive promotional content from the Los Angeles Times.

