Need a leadoff man? Go figure
If you’re a serious baseball fan, you know Ernie Broglio. If the trivia category is “All-Time Worst Trades” and the challenge is to name the player the Chicago Cubs got when they traded Lou Brock, the answer is Broglio.
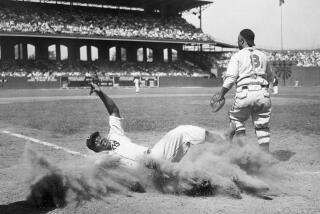
Brock got into the Hall of Fame on his first try, as the outfielder atop the St. Louis Cardinals’ lineup during their glory years of the 1960s. The Cardinals counted on Brock to hit .300, score 100 runs and steal 50 bases every year.
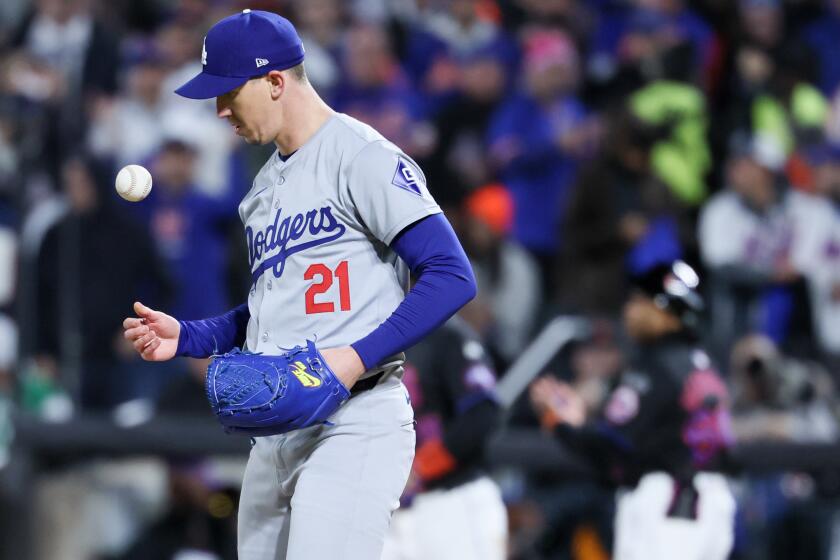
Juan Pierre can do all that.
The Cardinals were thrilled to have Brock. So were their fans. No one questioned his value.
The Dodgers were thrilled when they signed Pierre over the winter, but a vocal brigade of fans objected and a chorus of statistical analysts chuckled.
As Pierre enters his seventh full season, the statistics from his first six are essentially similar to the numbers Brock put up in his first six. The criticism of the Pierre signing reflects the rise of a new wave of statistical analysis and its widespread dissemination via the Internet.
In Brock’s era, batting average ruled. Today, the Dodgers are condemned for paying attention to the wrong statistics.
Keith Law, a former assistant general manager for the Toronto Blue Jays, labeled Pierre on ESPN.com “a player whose ideal role is defensive replacement/pinch runner.” At Baseball Prospectus, a baseball think tank, Marc Normandin alluded to Pierre’s high stolen base total in calling him “more useful to your fantasy baseball team than a real team.” Dodger Thoughts blogger Jon Weisman, slapping General Manager Ned Colletti, said the signing of Pierre had “validated the worst fears of anyone who suspected he was too enamored of pointless statistics ... to make sensible decisions.”
The criticism spread to talk shows, to message boards and even to the Dodgers’ website, where public relations director Josh Rawitch pleaded for mercy for Pierre.
“I sure hope you will all give him a chance,” Rawitch wrote, “to win you over.”
*
The waiver wire buzzes regularly, and players can be yours for a token fee. Kevin Towers, general manager of the San Diego Padres, looked up one day to find his young assistant begging him to claim a minor league infielder with a mediocre batting average, no power and a weak arm.
“He’s an on-base machine,” the assistant said.
“Look at his size,” Towers said. “Look at the scouting reports.”
The Padres passed. The Angels claimed David Eckstein, who developed into the shortstop on their World Series championship team.
“We followed him and saw what he ended up doing,” Towers said, “and said we better start paying attention to some of these things.”
And the young assistant? He was Theo Epstein, hired two years later as general manager of the Boston Red Sox, at age 28.
Epstein represents a new generation of baseball executives, one that challenges conventional wisdom through statistical analysis. Playing experience is not required.
“You’ve got guys who would normally spend four years at Goldman Sachs out of college now applying for baseball jobs,” Oakland Athletics General Manager Billy Beane said. “Instead of running hedge funds eight years later, they’re on their way to becoming general managers. To me, that’s great. You want the best and brightest in your game.”
And so the analysts multiply -- some with jobs in baseball, some in search of them, some enjoying a hobby, all in search of information that could give a team an edge. With a laptop computer, fans can conduct their own research -- in evaluating players and otherwise -- then publish it.
On a recent morning, Beane took note of a website that attempted to calculate how many runs the A’s could score with every possible lineup combination.
“With the Internet and blogs, you have so much more,” Beane said. “You’ve almost got a ‘wisdom of the crowd’ situation.”
That wisdom can turn intuition on its head, or validate it. Two decades ago, Angels manager Gene Mauch dismissed conventional theory by using Brian Downing as a leadoff hitter. Downing did not fit the mold of the typical leadoff hitter -- he did not hit .300 or steal bases, as Pierre does -- but he walked a lot and therefore got on base more often than his teammates.
The data is in. The correlations have been checked. Mauch was right.
“The two statistics that are the greatest determining factors in whether you win games,” Beane said, “are team ERA and on-base percentage.”
*
The traditional display on a ballpark scoreboard presents the Triple Crown offensive statistics -- batting average, home runs and runs batted in. The Baseball Prospectus glossary offers dozens more, from on-base percentage and slugging percentage to newer measures listed by such acronyms as EqA and WARP-3.
“It seems like each and every year there’s a new stat to look at,” Towers said. “I think there are organizations that aren’t looking at that type of stuff, and I think they’re missing the boat.”
This isn’t all new. Colletti charted batter-pitcher matchups as a publicist for the Chicago Cubs in 1984. Angels General Manager Bill Stoneman said he used OPS, the now-popular combination of on-base percentage and slugging percentage, as an executive with the Montreal Expos two decades ago.
Today, the Angels employ a statistical analyst and compile proprietary information. When they signed outfielder Gary Matthews Jr. to a five-year, $50-million contract over the winter, after career highs in virtually every offensive category last season at age 31, had the Angels developed any data to suggest Matthews might not have had a career year?
“Not really,” Stoneman said. “It’s more scouting-related. We got him to help with our defense, and he should be a big help. But that comes from scouting, especially defensively -- his first-step quickness, the jumps he gets, the routes he takes to the ball, throwing arm. It’s all stuff you’ve got to see.”
Stoneman said he considers “a lot more” than statistics in evaluating players.
“What kind of a person is he?” Stoneman said. “How does he fit within the club? Does he play with a lot of heart? Is he a distraction to the club? There’s a lot of thought that goes into it.”
Said Colletti: “When you’re looking at statistics, you’re basically looking at a resume. I don’t know that a lot of companies would hire without bringing somebody in and talking to them and finding out what they’re really like.”
Nothing drives statistically oriented fans batty more than intangibles -- heart, character, chemistry and other such terms impossible to quantify. Colletti uses them proudly.
“I would say, when I first came into the big leagues in 1982, it was 95% scouting and 5% statistics, something like that,” he said. “Now there’s a lot more factors involved. Scouting is something I put a lot of priority on. We take into account statistics and character -- the history of the player in every way.
“Statistics have certainly come on to play a much greater role, but I don’t put all my credence in statistics. I don’t make half an evaluation of a player simply based on statistics.”
*
Pierre led the National League in at-bats last season. He led the league in hits, as his supporters point out. He led the league in outs, as his detractors point out.
He attracted many detractors because of his contract -- five years for $44 million -- but this case against Pierre is statistical more than financial. He has little power, he can’t use his speed unless he gets on base and even then he can run unwisely.
He has ranked second in the league in stolen bases but first in times caught stealing in each of the last three seasons, and his .330 on-base percentage ranked 130th among 160 major leaguers who qualified for the batting title last season.
“You’d rather have a slower guy with a .370 on-base percentage,” Baseball Prospectus executive editor Nate Silver said.
“He’s an interesting player to talk about,” Colletti said.
The floor is yours, Ned.
“First of all, the man’s character is outstanding,” Colletti said. “His love for the game, his ability to prepare for the game and help other teammates, to help young players -- I haven’t found anybody that gives the guy a B+. It’s all A’s, across the board. That’s going to be tough to measure in a stat book.
“When we’re in a close game, and somebody capable of stealing 30, 40, 50, 60 bases gets on base late in the game, that’s tough to defense. The speed of the player will keep the defense moving. It will keep the pitcher in a split-second of indecision or loss of concentration. It will keep the catcher in a position of worrying about the hitter, the pitcher and the baserunner.
“Players like that are very important players. There was a time, not too long ago, when he did walk more and his on-base percentage was higher. That’s the stat everybody keeps questioning, right?”
Colletti noted Pierre set a career high in walks for Florida’s 2003 World Series championship team, and suggested he and Rafael Furcal could duplicate the chaos Pierre and Luis Castillo created atop that Marlins lineup.
Brock wreaked havoc for two championship teams in St. Louis; Colletti called him “a great example.”
Said Stoneman: “If we had a chance to sign a modern-day Lou Brock, we’d sign him yesterday.”
In fairness, the statistical similarities between Brock and Pierre do not reflect that Brock developed modest power and played in a pitching-rich era that made a one-run offense more of a necessity. But Brock also led the league in times caught stealing seven times -- probably enough to keep Beane from signing a modern-day Lou Brock, although Beane wouldn’t say.
“I came up with Lou Brock as a fan,” Beane said. “He’s a Hall of Fame player. That’s all I need to know. If I had to pay players in the ‘60s, I would have to evaluate them. But I don’t.”
In his office at Dodger Stadium, Colletti reaches across a table and runs his finger across a sheet filled with statistics. Pierre, it turns out, has a higher career on-base percentage than Brock, the Hall of Famer.
“That,” Colletti said with a smile, “is good news.”
*
*
Begin text of infobox
Statistical similarities
Comparing the first six full seasons of Hall of Fame outfielder Lou Brock and new Dodgers outfielder Juan Pierre, with “full season” defined as 500 at-bats:
LOU BROCK
*--* YEAR AB R H BB SB CS BA OBP 1963 547 79 141 31 24 12 258 300 1964 634 111 200 40 43 18 315 358 1965 631 107 182 45 63 27 288 345 1966 643 94 183 31 74 18 285 320 1967 689 113 206 24 52 18 299 327 1968 660 92 184 46 62 12 279 328
*--*
*--* Six-year avg.* AB R H BB SB CS BA OBP 634 99 183 36 53 18 293 330
*--*
*75% stolen base success rate
JUAN PIERRE
*--* YEAR AB R H BB SB CS BA OBP 2001 617 108 202 41 46 17 327 378 2002 592 90 170 31 47 12 287 332 2003 668 100 204 55 65 20 305 361 2004 678 100 221 45 45 24 326 374 2005 656 96 181 41 57 17 276 326 2006 699 87 204 32 58 20 292 330
*--*
*--* Six-year avg.* AB R H BB SB CS BA OBP 652 97 197 41 53 18 302 348
*--*
*75% stolen base success rate
--
Source: baseball-reference.com
More to Read
Are you a true-blue fan?
Get our Dodgers Dugout newsletter for insights, news and much more.
You may occasionally receive promotional content from the Los Angeles Times.


