TIMES POLL / A Look at the Electorate
- Share via
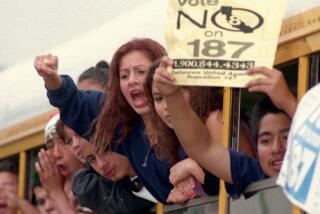
A Times statewide exit poll shows the demographic makeup of Tuesday’s California electorate and how the groups voted for governor, U.S. senator and on Proposition 187.
How the Poll Was Conducted
The Times Poll interviewed 5,336 voters as they exited 85 polling places across the state. Precincts were chosen based on the pattern of turnout in past general elections. The survey was by confidential questionnaire. The margin of sampling error for percentages based on the entire sample is plus or minus 3 percentage points. For some subgroups the error margin may be somewhat higher. Because the survey does not include absentee voters or those who declined to participate when approached, actual returns and demographic estimates by the interviewers were used to slightly adjust the sample. Davis Market Research Services Inc. of Calabasas assisted The Times in this poll.
% OF ALL % WHO % WHO % WHO VOTERS VOTED FOR VOTED FOR VOTED FOR WHO ARE BROWN WILSON FEINSTEIN GENDER 50% Male 38 58 42 50 Female 43 52 51 AGE 14% 18-29 years old 50 44 44 45 30-49 years old 41 53 46 25 50-64 years old 37 60 49 16 More than 65 years old 34 63 48 ETHNICITY/RACE 81% White 35 61 43 5 Black 77 20 80 8 Latino 72 23 67 4 Asian 50 46 52 HOUSEHOLD INCOME 14% Less than $20,000 55 40 57 25 $20-$40,000 40 54 45 24 $40-$60,000 40 55 43 37 More than $60,000 35 62 46 EDUCATION 20% High school or less 41 54 44 30 Some college 36 59 41 50 College graduates 43 53 51 PARTY AFFILIATION 40% Democrat 78 19 83 16 Independent 35 56 44 41 Republican 6 91 14 GENDER AND PARTY 17% Democratic men 79 19 83 22 Democratic women 77 19 84 9 Independent men 34 57 39 6 Independent women 39 54 51 22 Republican men 6 91 12 19 Republican women 6 91 17 POLITICAL IDEOLOGY 17% Liberal 80 15 83 46 Moderate 48 47 57 37 Conservative 12 84 17 IMMIGRATION STATUS 10% 1st generation 44 53 52 15 2nd generation 49 47 56 75 3rd generation or more 38 57 44 RELIGION 47% Protestants 29 67 35 25 All Roman Catholic 48 47 55 17 White Catholics 37 58 47 6 Jewish 56 41 81
% OF ALL % WHO VOTERS VOTED FOR WHO ARE HUFFINGTON 50% 50 50 40 14% 42 45 44 25 46 16 47 81% 49 5 14 8 22 4 40 14% 34 25 46 24 47 37 47 20% 47 30 49 50 41 40% 11 16 40 41 79 17% 12 22 10 9 44 6 36 22 83 19 75 17% 10 46 33 37 76 10% 41 15 35 75 47 47% 57 25 37 17 45 6 15
--- continued ---
% OF ALL % WHO % WHO VOTERS VOTED FOR VOTED AGAINST WHO ARE PROP. 187 PROP. 187 GENDER 50% Male 60 40 50 Female 56 44 AGE 14% 18-29 years old 47 53 45 30-49 years old 55 45 25 50-64 years old 63 37 16 More than 65 years old 68 32 ETHNICITY/RACE 81% White 63 37 5 Black 47 53 8 Latino 23 77 4 Asian 47 53 HOUSEHOLD INCOME 14% Less than $20,000 53 47 25 $20-$40,000 60 40 24 $40-$60,000 59 41 37 More than $60,000 58 42 EDUCATION 20% High school or less 66 34 30 Some college 62 38 50 College graduates 53 47 PARTY AFFILIATION 40% Democrat 36 64 16 Independent 62 38 41 Republican 78 22 GENDER AND PARTY 17% Democratic men 35 65 22 Democratic women 37 63 9 Independent men 61 39 6 Independent women 63 37 22 Republican men 80 20 19 Republican women 76 24 POLITICAL IDEOLOGY 17% Liberal 26 74 46 Moderate 55 45 37 Conservative 78 22 IMMIGRATION STATUS 10% 1st generation 54 46 15 2nd generation 51 49 75 3rd generation or more 60 40 RELIGION 47% Protestants 69 31 25 All Roman Catholic 49 51 17 White Catholics 58 42 6 Jewish 45 55
Note: Some numbers do not add up to 100% because not all answer categories are displayed.
Source: Los Angeles Times exit poll.
More to Read
Get the L.A. Times Politics newsletter
Deeply reported insights into legislation, politics and policy from Sacramento, Washington and beyond. In your inbox three times per week.
You may occasionally receive promotional content from the Los Angeles Times.


